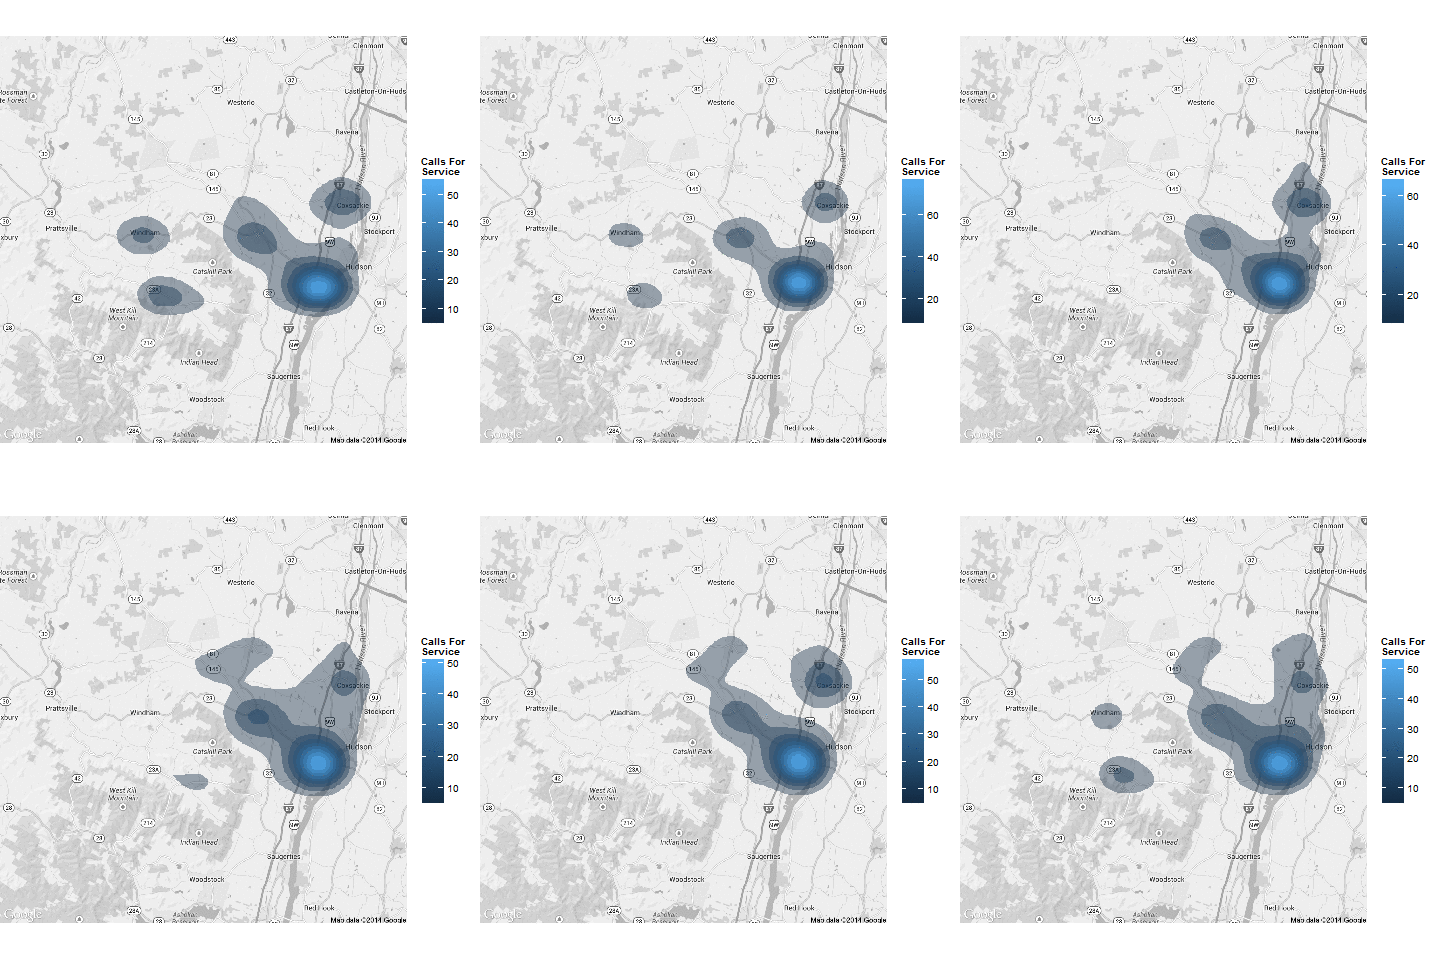
At work I have been working with some EMS calls for service data. After geocoding the data, I put together the following animation in R showing the calls for service by month:
 Due to confidentiality reasons I cannot disclose the data, however this is the code that created this animation:
library(ggplot2)
library(ggmap)
library(animation)
# Pull in the data
df <- read.csv("Greene Complete.csv", stringsAsFactors=F)
# Change the types
df$X <- as.numeric(df$X)
df$Y <- as.numeric(df$Y)
# Subset the data
df <- df[c('Month','X','Y')]
# Remove NA's
df <- df[!is.na(df$X),]
# Build the month vector
months <- df$Month
months <- months[!duplicated(months)]

saveGIF({
  for(month in months){
    data <- df[df$Month == month,]
    # Build the map
    map <- get_map(location = c(lon = -74.123996, lat = 42.295732), color = 'bw', maptype = "roadmap", zoom = 10)
    map <- ggmap(map, extent = "device", ylab = "Latitude", xlab = "Longitude")
    #map <- map + geom_point(data=data, aes(x=X, y=Y), size=2, color='red')

    overlay <- stat_density2d(data = data,
                              aes(x = X, y = Y, fill = ..level.. , alpha = ..level..),
                              size = 2, bins = 10, geom = "polygon")
    map <- map + overlay
    map <- map + scale_fill_gradient("Calls For\nService")
    map <- map + scale_alpha(range = c(0.4, 0.75), guide = FALSE)
    map <- map + guides(fill = guide_colorbar(barwidth = 1.5, barheight = 10))
    print(map)
  }
})
I would like to fix the scale to make it consistent month to month.
